User Experience
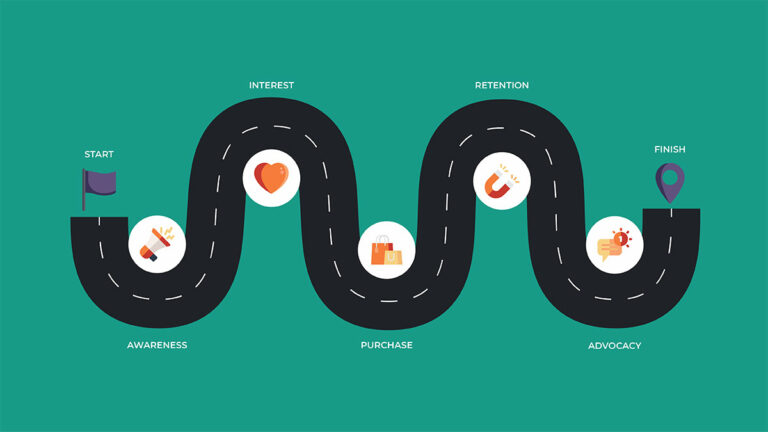
What Is A Customer Journey Map And How Is It Used In Marketing?
Customer satisfaction is one of the most important facets of success in business. In fact, research shows that 93% of
Customer satisfaction is one of the most important facets of success in business. In fact, research shows that 93% of
Here are 14 of the most common reasons why eCommerce sites fail and what you can do to help your website succeed.

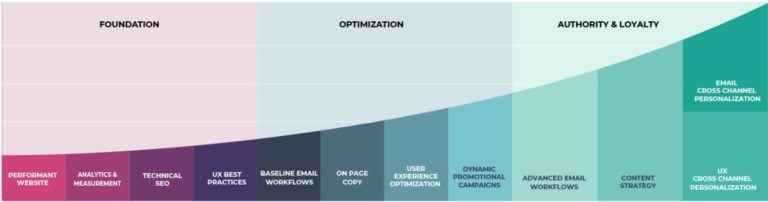
Executive Summary What makes an ecommerce business sustain revenue and profit in markets of rising digital advertising costs and increased
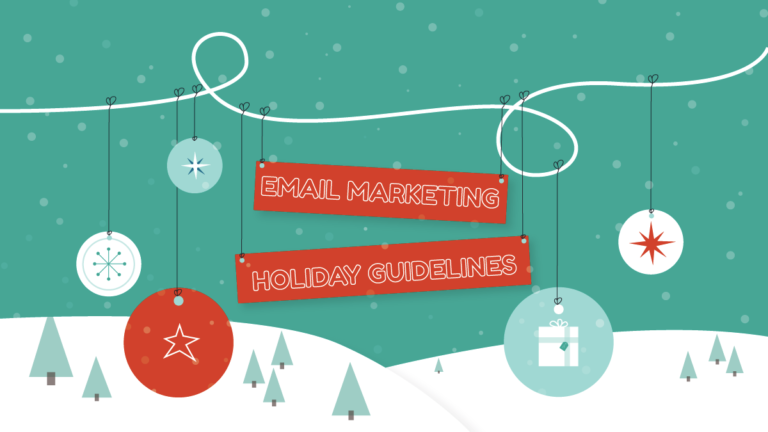
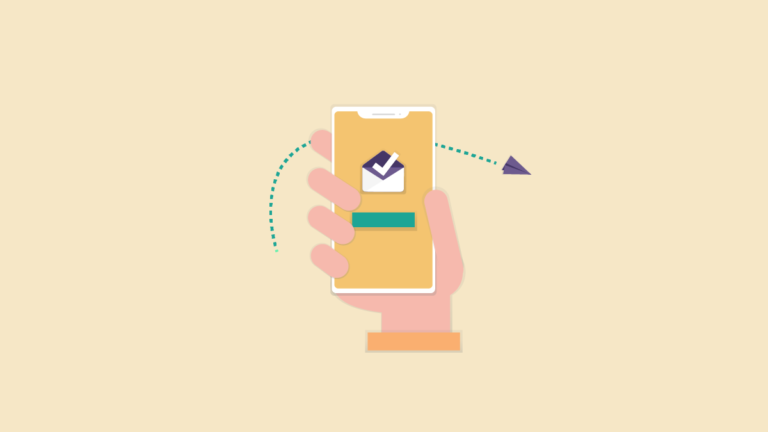
The holiday season is fast approaching, and it’s not too early to start optimizing your email program for the holiday
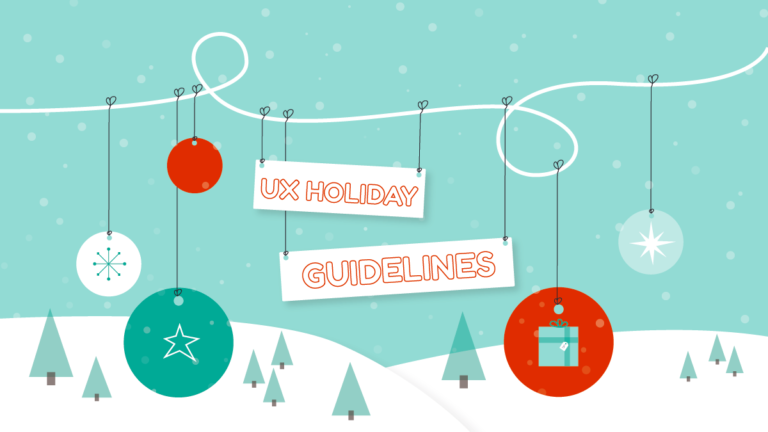
The holiday season is fast approaching, and it’s not too early to start optimizing your site for the holiday season.

Customers today are no longer just price-sensitive. They look for stores that offer them more than the lowest prices and

Here’s the scenario: You know you need a compelling email program, but you’re stuck on exactly how to use email

In an ever-expanding demand for online shopping, it’s essential that your brand keeps website experience top of mind. And after
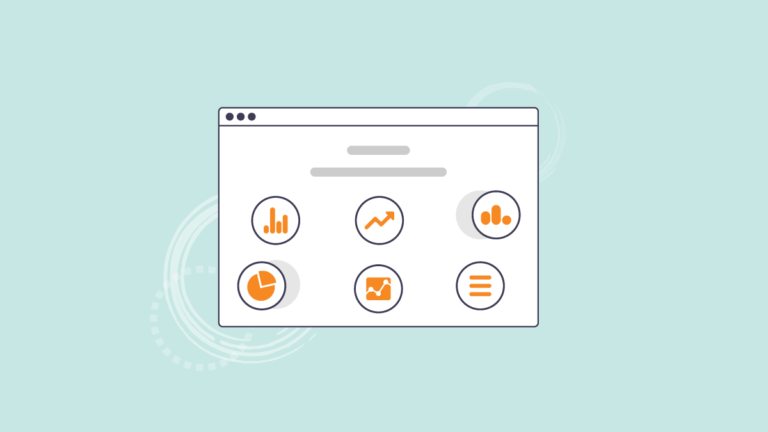
Key Performance Indicators (KPIs) are the lifeblood of any digital marketer. They tell you when you’re doing well and they
TRANSCRIPT BELOW ——————————- Craig Smith:Hi there. Good morning or good evening. My name is Craig Smith. I’m the founder and

Email marketing has been around for decades and remains a powerful tool for building relationships and driving revenue. In this
If you work in the digital or ecommerce industry, you have likely heard of the term “headless commerce” and may